Shared work
The paper uses “we” throughout and represents a team’s combined literature review, data analysis, policy selection, charts, and conclusions.
Case study · Collaborative data + policy research
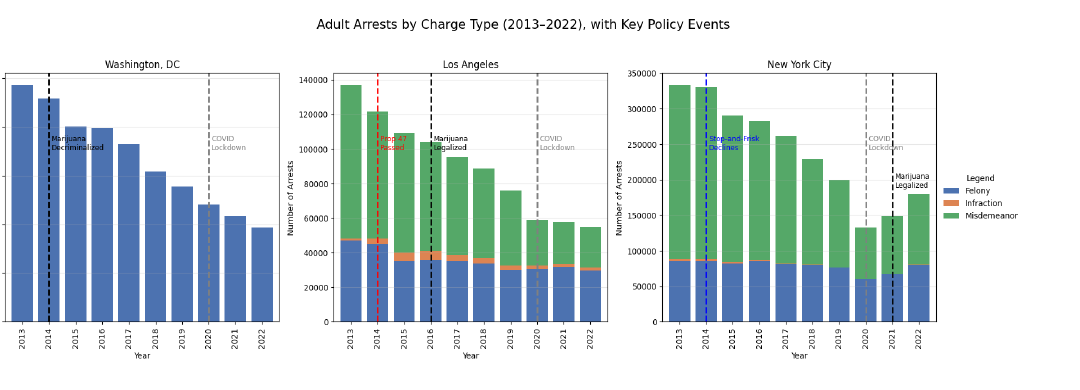
A three-city analysis asking what changed from 2013–2022, which shifts aligned with major policy events, and why falling totals do not automatically mean disparities are shrinking.
01 · The question
Short windows and single-city stories can make ordinary seasonality look like policy impact, or make aggregate declines look like equitable progress. The project compared adult arrest patterns across Washington, DC, Los Angeles, and New York City while mapping selected reforms to the timeline.
02 · My contribution and ownership
The paper uses “we” throughout and represents a team’s combined literature review, data analysis, policy selection, charts, and conclusions.
I helped frame the research questions, interpret the city and policy charts, and write the policy synthesis alongside my teammates.
03 · Evidence
The excerpts below are rendered directly from the submitted paper. Open the PDF for complete methods, citations, limitations, and team context.
 Enlarge image ↗
 Enlarge image ↗
 Enlarge image ↗
04 · Analytical approach
A falling number on its own answers almost nothing. Getting from a headline total to a defensible claim took four steps.
Step 1
Organize city, date, and charge-type fields so trend movement can be compared without treating unlike categories as identical.
Step 2
Place selected reforms, including marijuana decriminalization/legalization and Proposition 47, inside the observed timelines.
Step 3
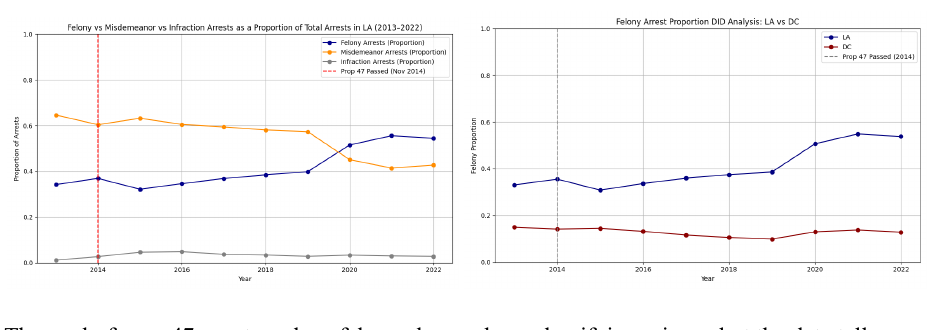
Use proportion trends and a difference-in-differences comparison to examine whether the direction of change matches the policy claim.
Step 4
Separate association from causation and acknowledge different reporting practices, population context, and data-quality limits.
05 · What emerged
Four things stayed true across the three cities, and none of them by itself settles the debate a headline number tends to imply.
Adult arrest totals declined across the three displayed city series from 2013–2022.
Reforms aligned with changes in some series, but the mechanisms and timing differed by city.
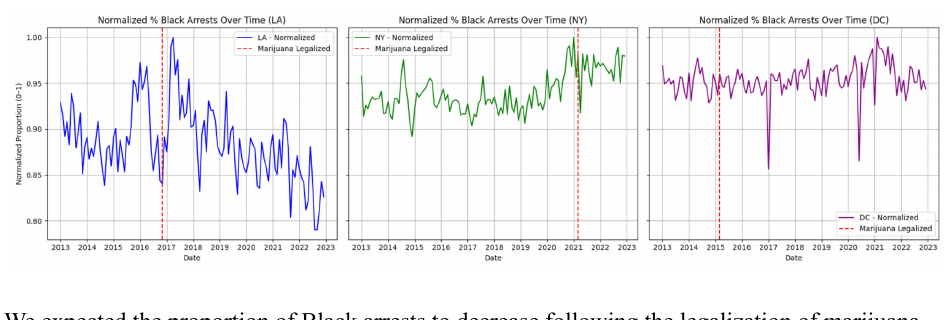
A lower total does not reveal whether the burden across charge types or racial groups changed equitably.
The observed trends complicate clean before-and-after narratives, particularly around Proposition 47 and legalization.
06 · Limitations
07 · Artifacts